Introducing SportsCardsPro Price Indexes
Card prices rise and fall over time as players become hot and certain sets become popular over the years. We've added a tool that let's you see how the value of a set is changing over time. We're calling it "SportsCardsPro Indexes".
The SP 500 or Dow Jones stock indexes tell you if the stock market is increasing or decreasing in value overall.
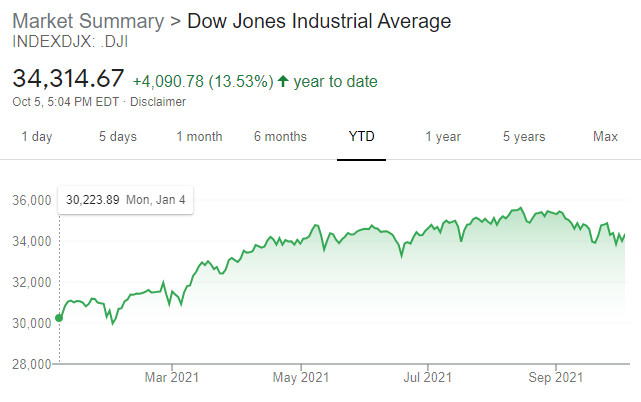
Our price indexes tell you the same thing for a particular set of cards.
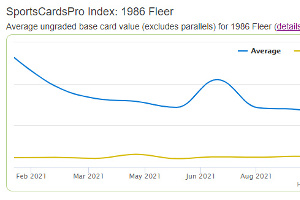
For every sports card set, you can see a chart showing the current average and median price for every card in that set. You can see how the prices change over time as well. Is 1986 Fleer Basketball becoming more popular? Or maybe 2020 Panini Prizm Football is dropping in price, while 2019 Topps Baseball is hot.
The indexes include only the base cards, no parallels and the index only considers ungraded cards. You can read more details about the indexes and how they are calculated.
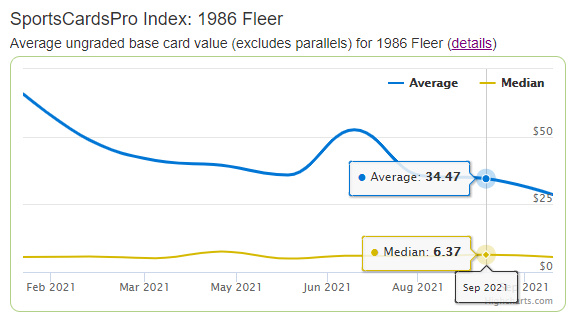
The index includes the average and the median by default but you can toggle either on or off. You can also touch/hover on any point on the chart to see details about the price at that particular point in time.
We decided to show both the average and the median because they show different summaries of a set's popularity/value. The median means the same number of cards are more expensive and less expensive than the median price. The median isn't impacted heavily by value changes in the most expensive cards. The average price is more volatile and will go up and down more when the most expensive cards increase or decrease in price.
We hope this tool is helpful for your sports cards collecting.
The SP 500 or Dow Jones stock indexes tell you if the stock market is increasing or decreasing in value overall.
Our price indexes tell you the same thing for a particular set of cards.
For every sports card set, you can see a chart showing the current average and median price for every card in that set. You can see how the prices change over time as well. Is 1986 Fleer Basketball becoming more popular? Or maybe 2020 Panini Prizm Football is dropping in price, while 2019 Topps Baseball is hot.
The indexes include only the base cards, no parallels and the index only considers ungraded cards. You can read more details about the indexes and how they are calculated.
The index includes the average and the median by default but you can toggle either on or off. You can also touch/hover on any point on the chart to see details about the price at that particular point in time.
We decided to show both the average and the median because they show different summaries of a set's popularity/value. The median means the same number of cards are more expensive and less expensive than the median price. The median isn't impacted heavily by value changes in the most expensive cards. The average price is more volatile and will go up and down more when the most expensive cards increase or decrease in price.
We hope this tool is helpful for your sports cards collecting.