Baseball Card Market Visualized Through PSA Population
Baseball card collectors send thousands of cards to be graded by PSA (and other grading companies) but they usually only send cards that they think are valuable and worth the grading fees.
It's possible to track the history and health of the Baseball market by looking at the PSA POP data to see which cards, sets, brands, and years are the most graded and most popular.
This article visualizes 134 years of baseball cards using the PSA population data in various ways to better see the trends, changes, and growth over the years.
List of Visuals
- Total Baseball Card Market by Year & Brand
- Grade Distribution By Year: % of Total Per Year
- Grade Distribution By Year: Number Per Year
- Market Share by Year: Panini vs Topps vs Fleer
- Number of Sets vs Population by Year
- Most Graded Baseball Card Sets of All Time
Total Baseball Cards Graded By Year and Brand ^ To Top
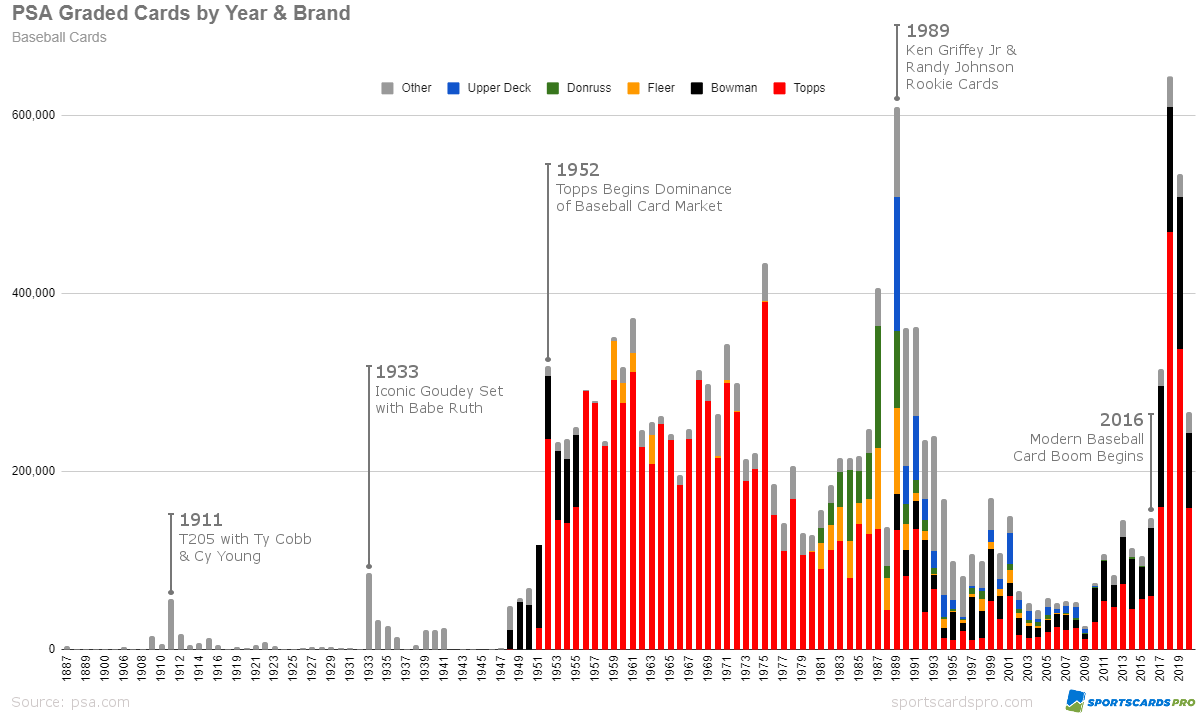
The below chart shows the baseball card market from 1887 until 2020.
The overall height of the data represents the number of cards graded that year. The different colors are the major baseball card brands. So you can see the overall market trends and how each brand has ebbed and flowed over time too.
The notes in the chart explains noteworthy events and how they impacted the baseball card market.
It's clear to see from the chart that Topps has been the dominant baseball card brand since the early 1950's. Other brands like Donruss, Fleer, and Upper Deck had short periods of popularity but quickly faded.
We didn't include sets that span multiple years in the visualizations. That means the 1909-11 T206 set is not included.
Baseball Cards Graded by Year and Brand
PSA Grade Distribution by Year: % Total Per Year ^ To Top
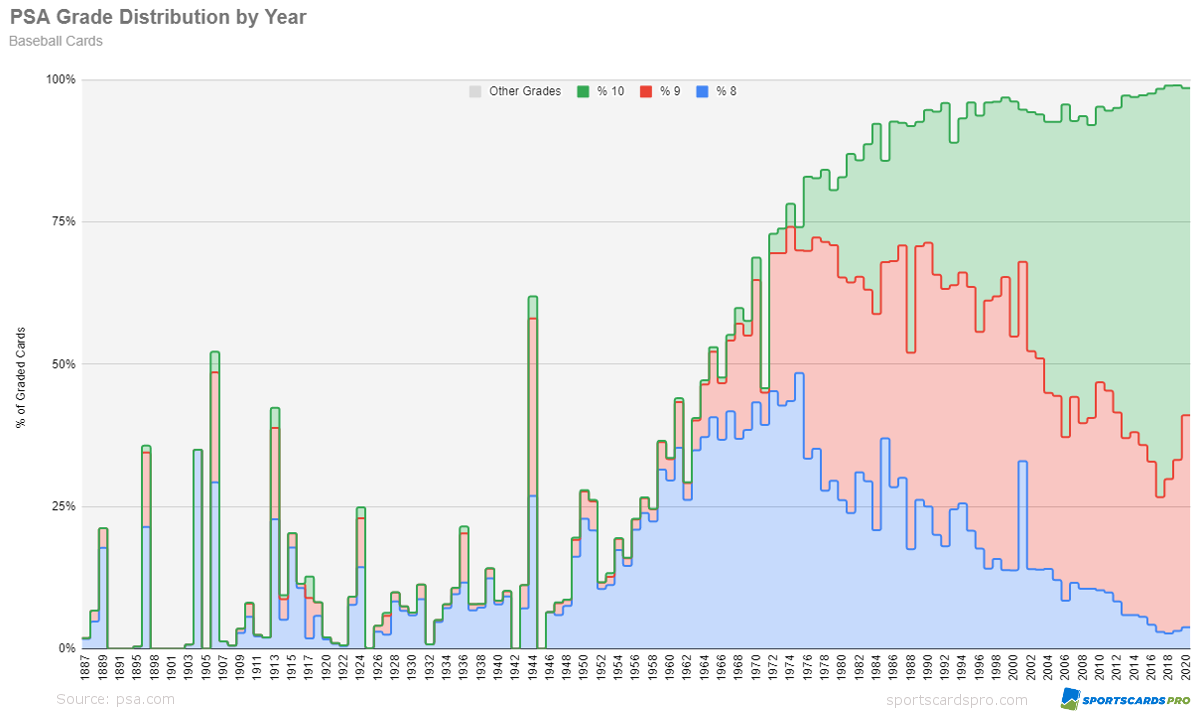
As grading has become more popular, collectors have started sending in their cards for grading right after opening them. Gone are the days of dinged up corners or putting greasy fingers on the front. With this change the PSA grade distribution has drastically changed too.
Initially, an average of 5-10% of cards received PSA 8 or better. In 1946, PSA 8 started to grow until it was 40% of graded cards in the 1960's, but PSA 9 and 10 were still rare. In the mid 1960's, PSA 9 grew it's share of the market and finally PSA 10 started increasing in the 1970's while PSA 8's share of the population gradually declined.
By 2020, almost 90% of cards graded were PSA 9 or better.
How will this impact card prices in the future? PSA 10 will no longer be as rare as it once was. Will collector's continue to pay big premiums for top grades if they aren't as rare?
Percent of Cards Getting A Particular Grade By Year
Grade Distribution by Year: Total Population ^ To Top
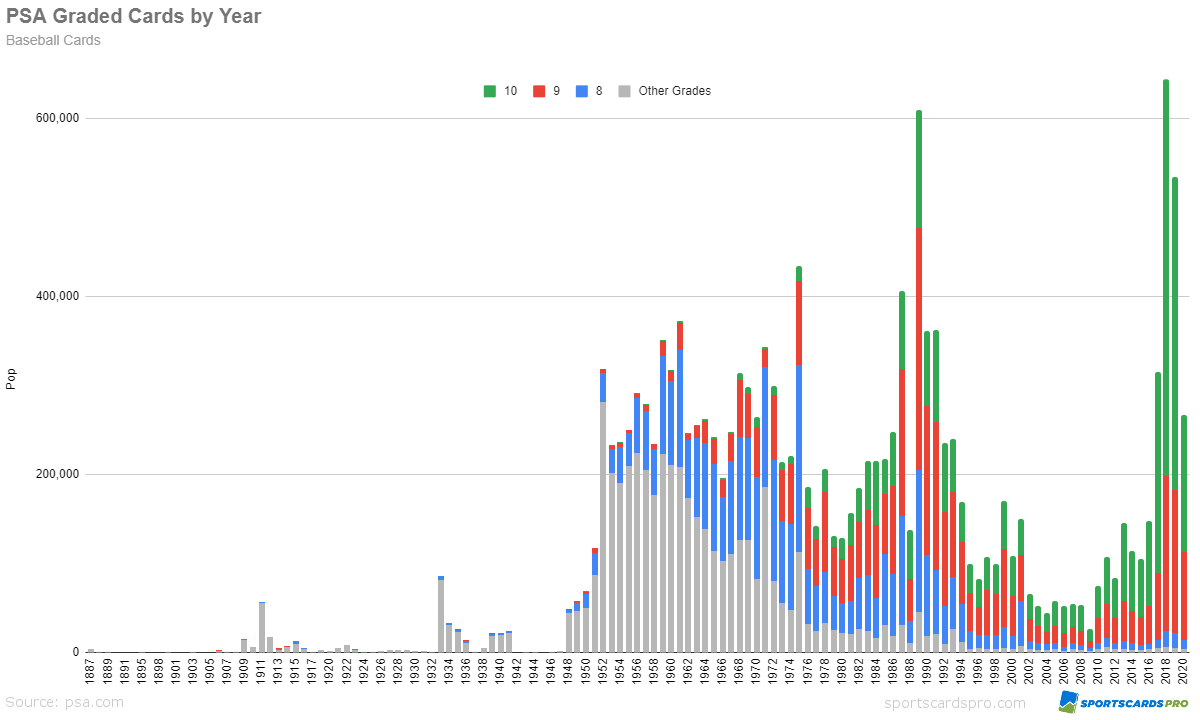
Not only has grade distribution shifted towards PSA 9 and 10, the total population of cards has shifted higher.
Virtually all of the recent growth in PSA grading has occurred at PSA 9 and PSA 10. PSA 8 and other grades haven't even reached their peaks in the 1990's and sub 8 grades are almost non-existent.
Total Number of Cards Getting A Particular Grade By Year
Topps vs Bowman vs Fleer: Percentage of Graded Cards by Year ^ To Top
The baseball card brand favored by collectors has almost always been Topps. Since 1951, there have only been 15 years where Topps was not the brand with the most PSA graded cards.
Topps' completely dominated in the 50's, 60's, and 70's. Then slowly declined in the 80's and 90's and eventual rose again in early 2000's.
Even though Topps brand cards lost their top position in the 80's and 90's. Topps company was still dominant because Bowman (a Topps brand since 1956) replaced Topps as top brand.
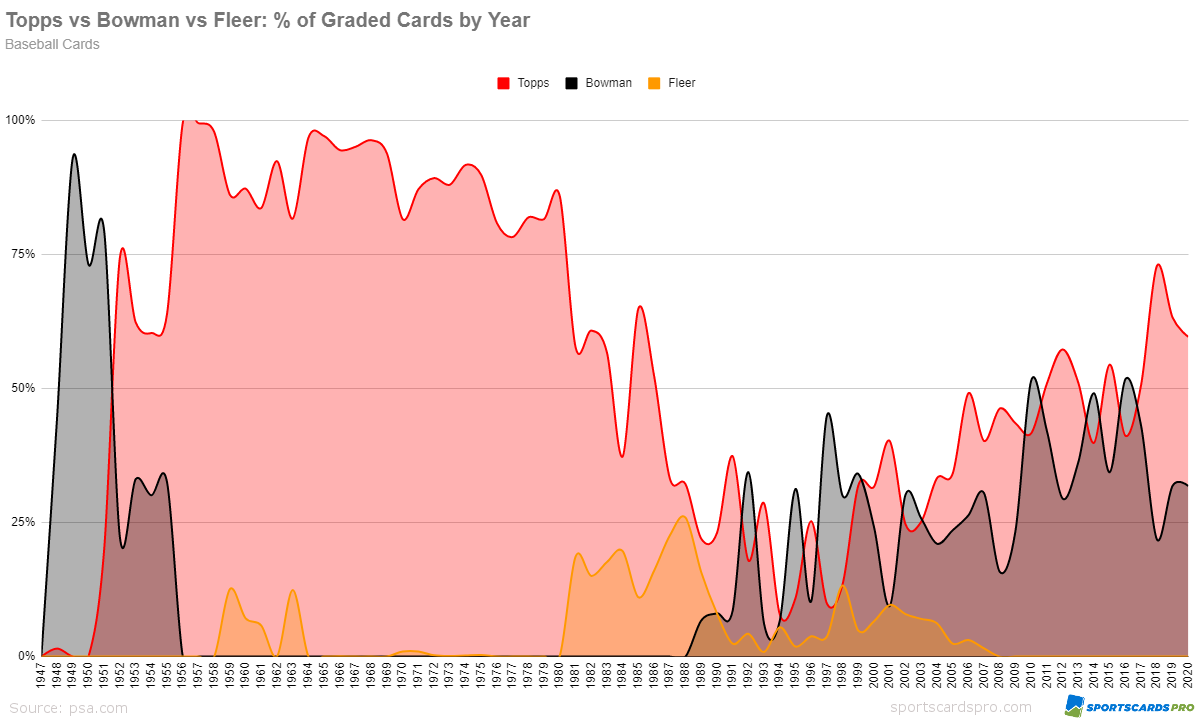
Market Share by Year: Topps vs Bowman vs Fleer
Number of Baseball Sets Per Year vs Total Population^ To Top
You can see the rise, crash, and rise again in the baseball card market in this chart.
Before the 1980's only a handful of a sets were released each year. As the hobby grew in popularity manufacturers released more and more sets. But in the mid-1990's PSA population started declining as collector's thought there were fewer cards worth grading.
The number of sets continued to increase until there were about 1,000 sets in 2005. Only 56,000 cards were graded from that year though (1/10th the peak in 1989).
In 2010, the number of graded cards started increasing again along with the number of sets.
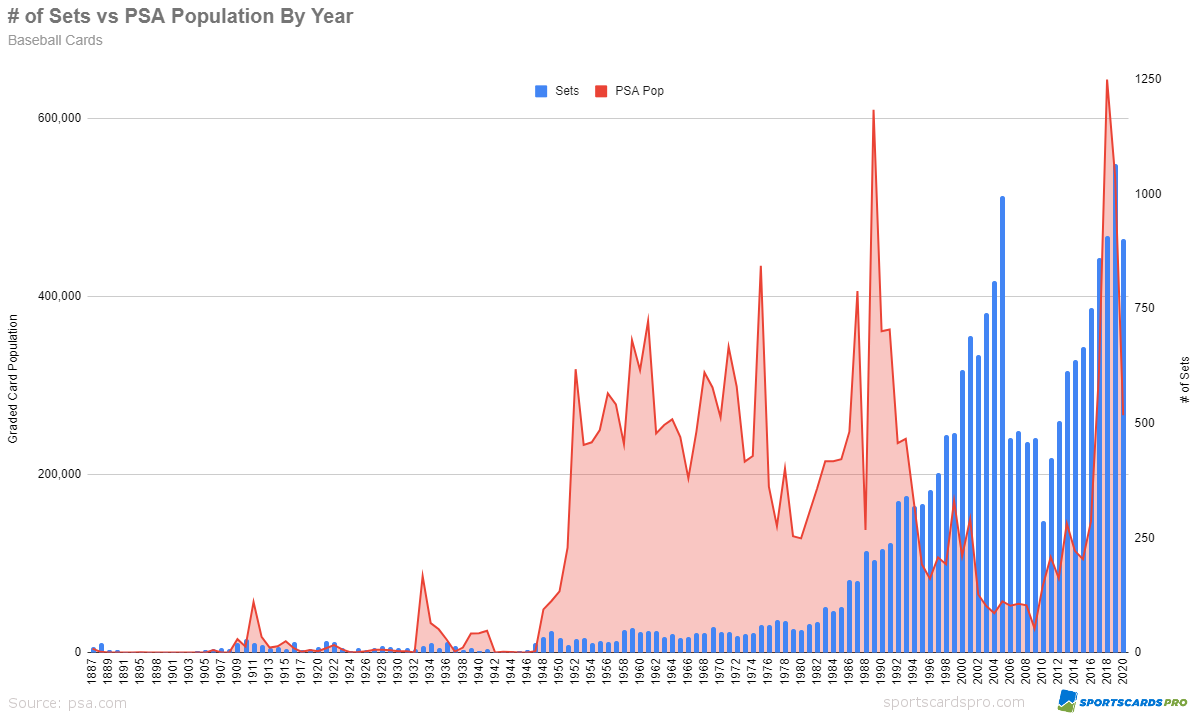
Number of Sets vs Card Population
The recent average number of graded cards per set is still really low by historic standards though. In 2019, the average set had 709 graded cards. In the 1950-70's, there were 5,000-10,000 graded cards per set.
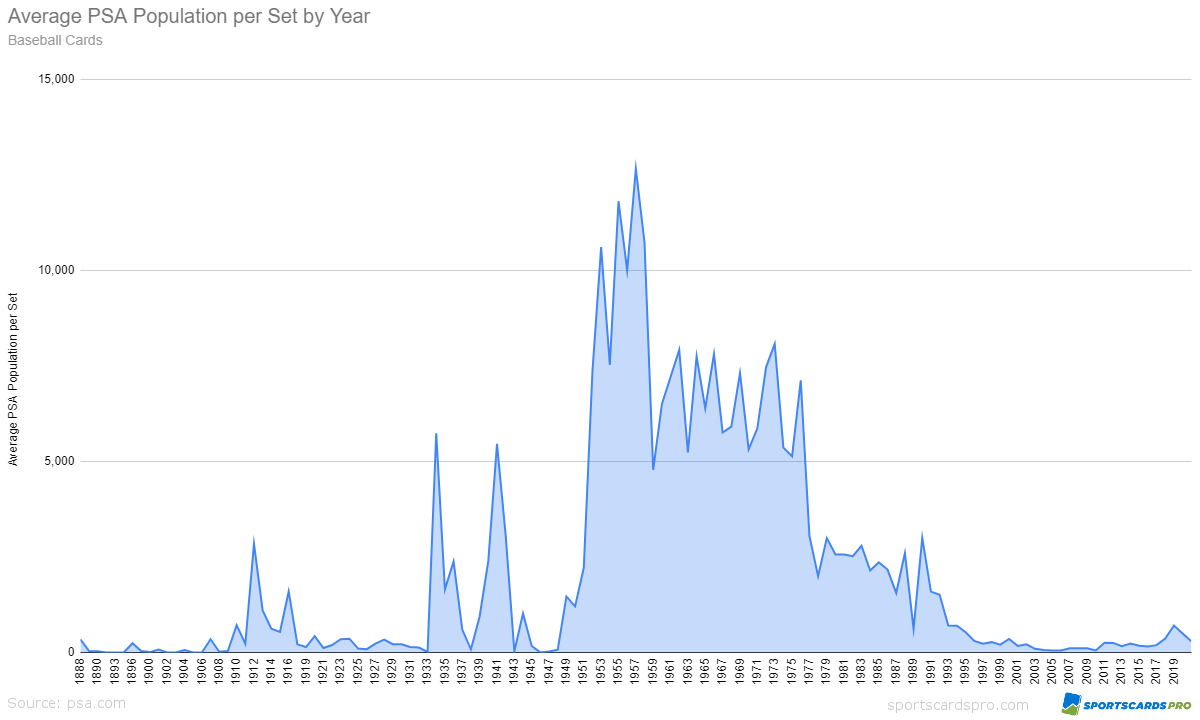
Average number of Graded Cards per Set
Most Graded Baseball Card Sets of All Time ^ To Top
A list of the baseball card sets with the highest overall PSA population. These are the sets that collectors favor the most.
The list is dominated entirely by Topps sets. 1909-11 T206 is the only set in the top 25 that is not Topps brand.
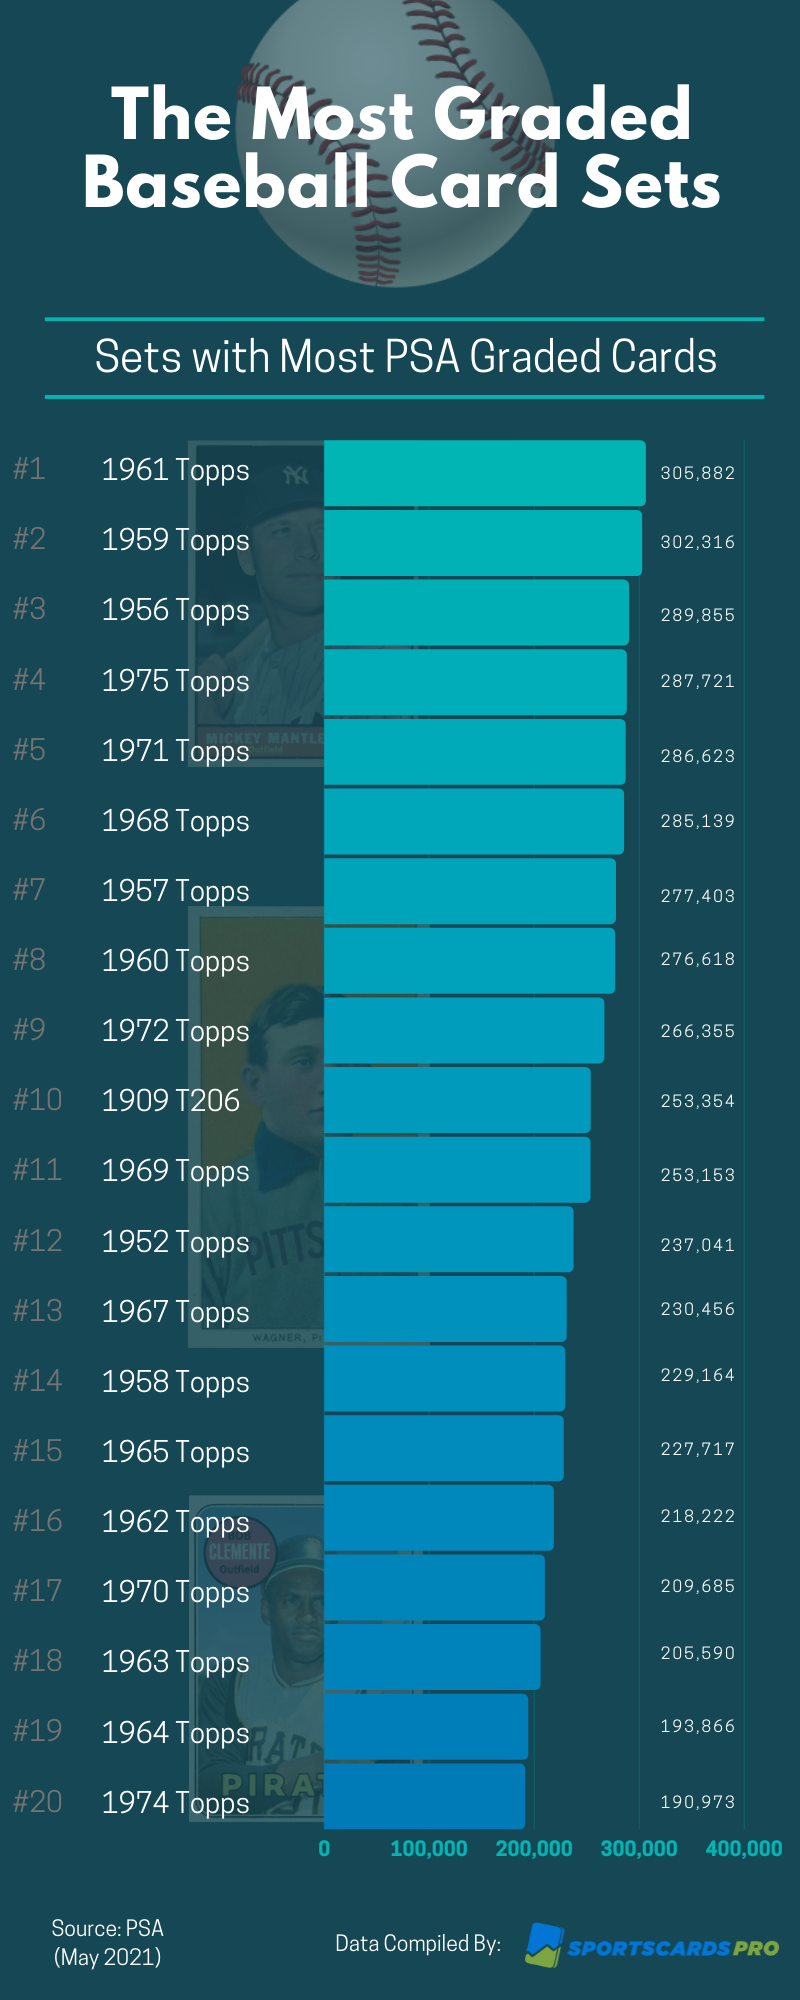
Most Graded Baseball Sets of All Time
Below are the top baseball card sets that aren't Topps.
| Set | Total |
|---|---|
| 1909-11 T206 | 253,354 |
| 1989 Upper Deck | 150,359 |
| 1987 Donruss | 113,495 |
| 1951 Bowman | 93,387 |
| 1990 Leaf | 92,780 |
| 1989 Fleer | 81,995 |
| 1955 Bowman | 81,182 |
| 1992 Bowman | 80,928 |
| 1984 Donruss | 77,509 |
| 1933 Goudey | 77,294 |
| 1954 Bowman | 71,036 |
| 1952 Bowman | 70,655 |
| 1953 Bowman Color | 68,806 |
| 1989 Donruss | 57,524 |
| 1984 Topps | 56,789 |
| 1949 Bowman | 53,942 |
| 1950 Bowman | 50,298 |
| 1989 Score Traded | 46,034 |
| 2018 Topps Chrome | 44,916 |
| 1959 Fleer Ted Williams | 44,131 |